
[vc_row][vc_column width=”2/3″ el_class=”section section1″][vc_column_text]In August, the Dow Jones Industrials (DJIA) went up by 2.2% and the S&P 500 went up by 3%. The C Fund is based on the S&P 500 Index.
Biggest TSP Returns for August
The S Fund was at the top of the list of the TSP funds for August. It had a return of 4.57% The S Fund is also leading all finds for the year-to-date return coming in at 12.84% as well as the best twelve-month return at 23.34%.
Coming in second is the C Fund with a year-to-date return of 9.91% and a 12-month return of 19.63%. In August, the C Fund went up 3.26 percent. This fund is the second most widely held fund in TSP.
Of all the TSP funds, the G Fund has the most assets.
The Safety of the G Fund Does Not Come Free
- Also Read: Beneficiary Forms: Trends in Updates and Common Mistakes for Federal Employees
- Also Read: How-to Guide: RMD Planning for TSP and IRAs—Key Differences Explained
- Also Read: FEGLI Guide: Comparing Federal Life Insurance to Private Policies for Retirees
Lowest of the TSP return rates in 2018 is the F Fund with a negative return of -0.86 percent.
The G Fund has over the long term, consistently underperformed the TSP stock funds.
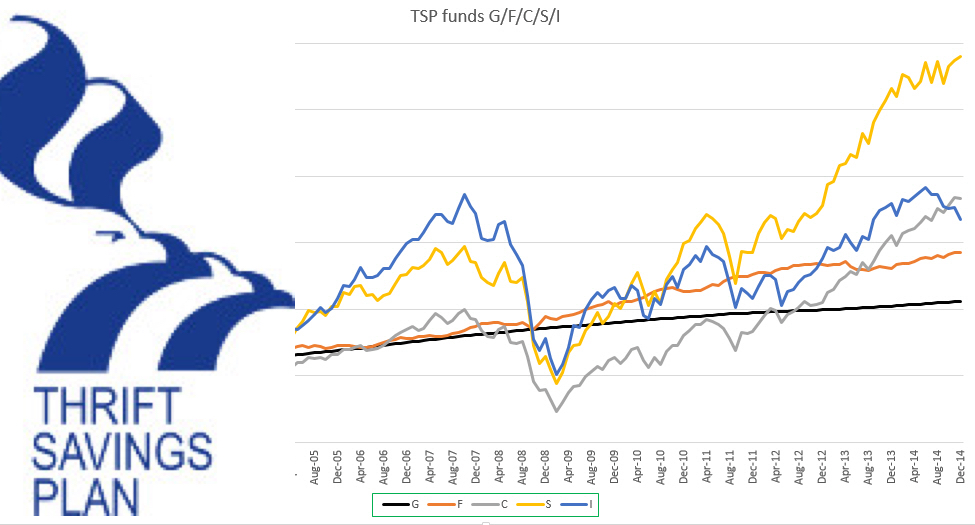
TSP Fund Returns for August 2018, Year-to-Date and Last 12 Months
Let us have a look at the latest performance data for all of the TSP funds:
MONTH YTD 12 MONTH
G Fund 0.26% 1.88% 2.66%
F Fund 0.67% -0.86% -0.90%
C Fund 3.26% 9.91% 19.63%
S Fund 4.57% 12.84% 23.34%
I Fund -1.91% -1.95% 4.79%
MONTH YTD 12 MONTH
L Income 0.61% 2.74% 4.99%
L 2020 0.80% 3.30% 6.87%
L 2030 1.28% 4.71% 10.30%
L 2040 1.47% 5.26% 11.77%
L 2050 1.65% 5.77% 13.14%
Average Balance for TSP Participants
Federal workers in the CSRS (Civil Service Retirement System) have the highest average balance in the TSP. Here is a table showing how TSP investors fare based on their retirement system as of July this year.
FERS CSRS Uniformed Service
Total Participants 3,332,206 323,032 1,402,304
Average Balance $143,048 $148,247 $25, 021
No of Roth Participants 501,374 9,937 544,991
Average Roth Balance $12,778 $19,679 $7,730
According to the above data, the number of post-separation withdrawals has steadily increased. The Thrift Saving Plan reports that the totals expected for 2018 are about 12% higher than those in 2017. This goes hand in hand with a retirement report from OPM indicating an increase in the number of TSP participants reaching retirement age.
TSP Transfers in July
Investors in the TSP moved more than $1 billion into the G Fund in July. The S Fund and the Lifecycle Funds both had an uptick in transfers in July; $94,000,000 and $104,000,000 respectively.
Investors transferred $601,000,000 from the C Fund, $567,000,000 from the I Fund, and $79,000,000 from the F Fund.
At the end of July, there was about $568 billion in the TSP plan.
[/vc_column_text][/vc_column][vc_column width=”1/3″][vc_single_image image=”34602″ img_size=”292×285″ style=”vc_box_shadow”][/vc_column][/vc_row]